Cash Forecasting
What Flocuity does for your cash
The forecast
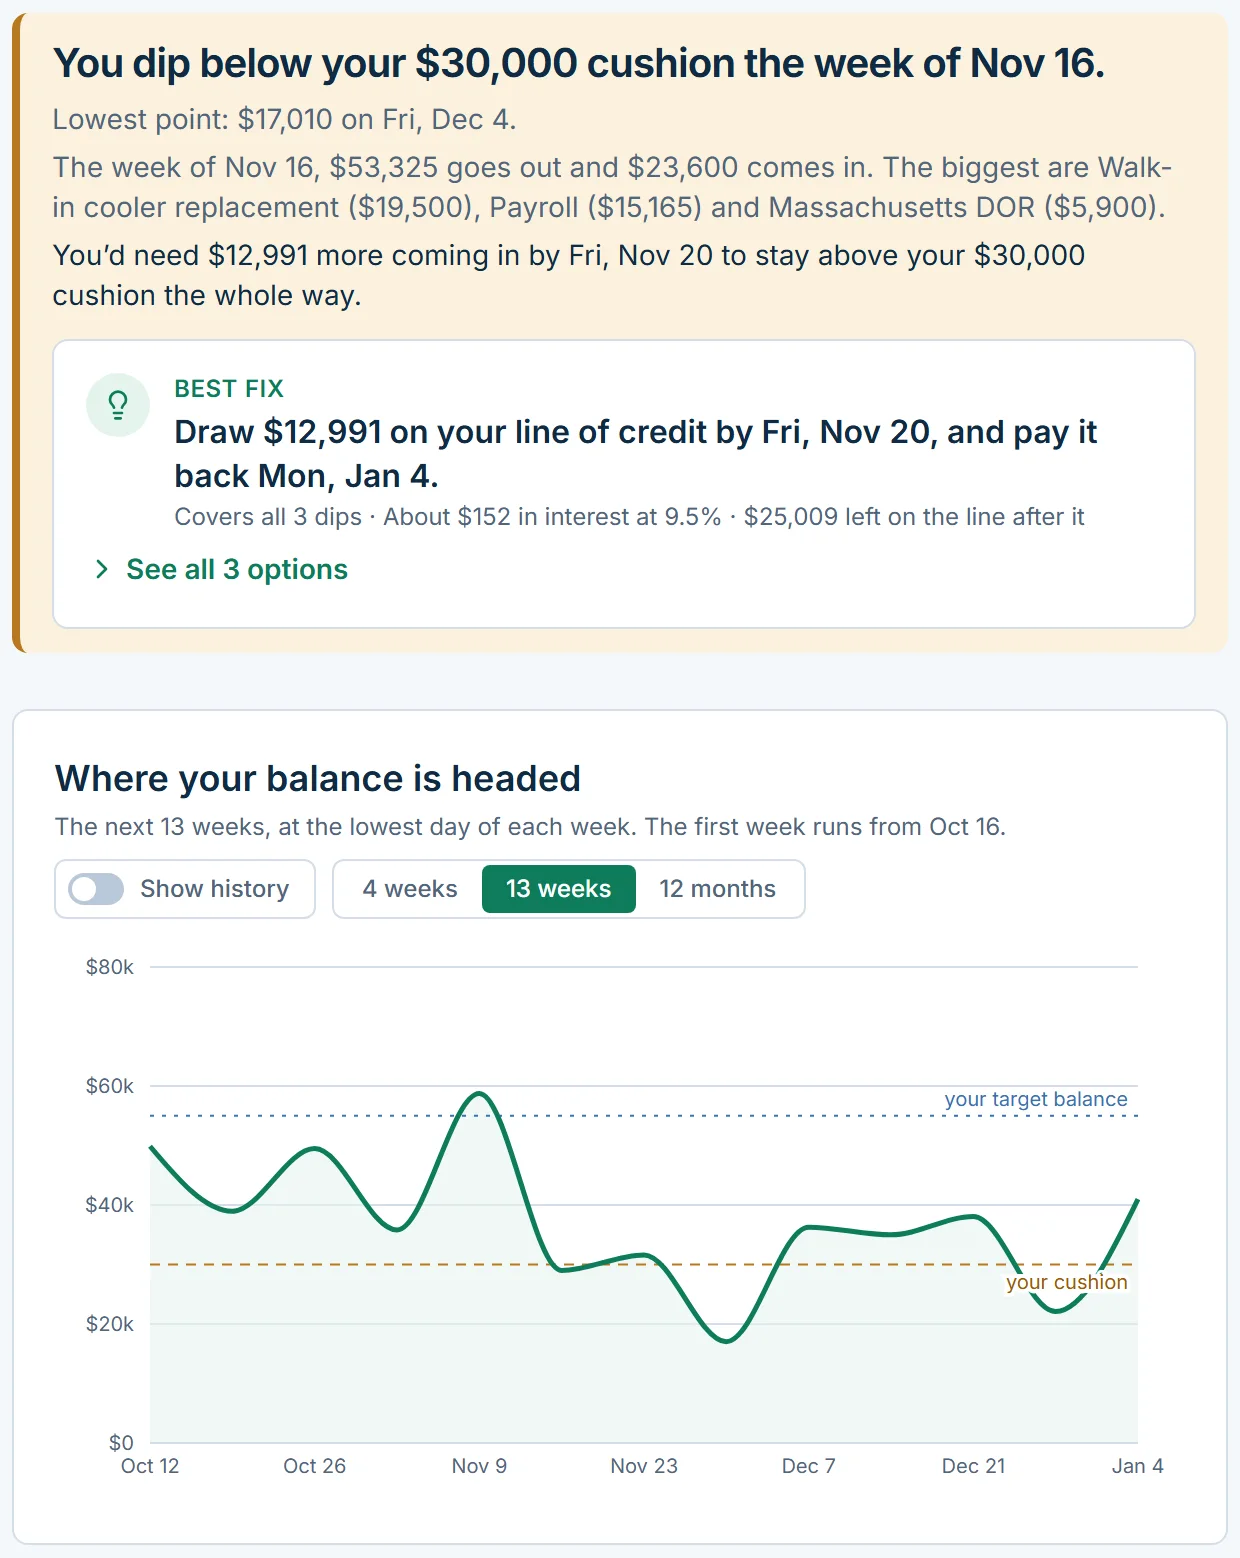
One sentence tells you if you’re OK
The Dashboard opens with one sentence: you’re fine, or you aren’t, and when, and the best fix if you aren’t. Below it, the money coming in and going out, day by day, and your balance against your cushion. The cash flow projection looks 13 weeks out by default, or switch to days or months.
- Built from your recurring items, your payroll, your taxes and your trends
- Tap or click any day to see exactly what’s in it
- Tracks how close past forecasts came, so you know how far to trust it
- Turn on Show history to see the last 13 weeks from your bank beside the next 13
- Simplified for a quick look, Detailed for every line behind it
Money in and money out
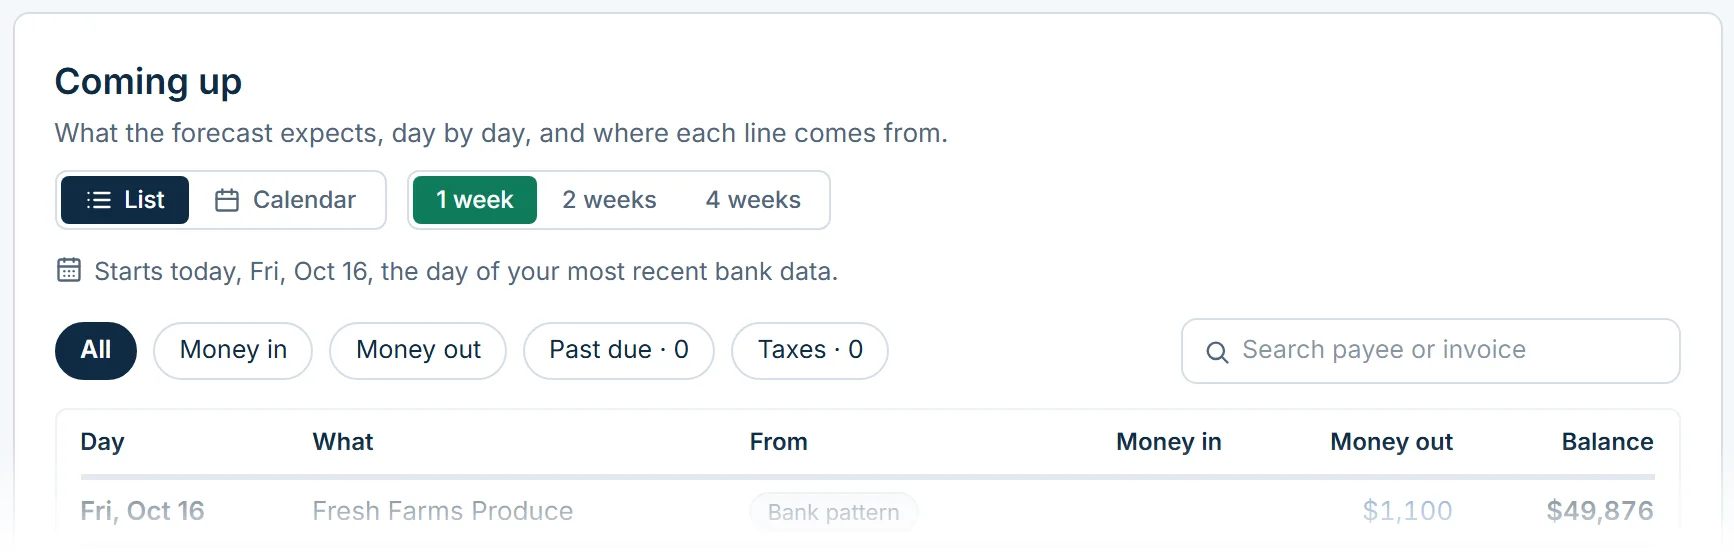
Every bill and invoice in one list
Flocuity keeps one list of everything it expects, and it’s quick to correct.
- Recurring bills and income found in your history automatically
- Open invoices and bills with due dates, in date order
- Past-due invoices and bills from your books are flagged and moved two weeks out, or on Plus, an invoice to the day its customer usually pays
- Invoices more than 90 days past due are left out until you say otherwise
Swipe the picture sideways for all of it.
Cushion and alerts
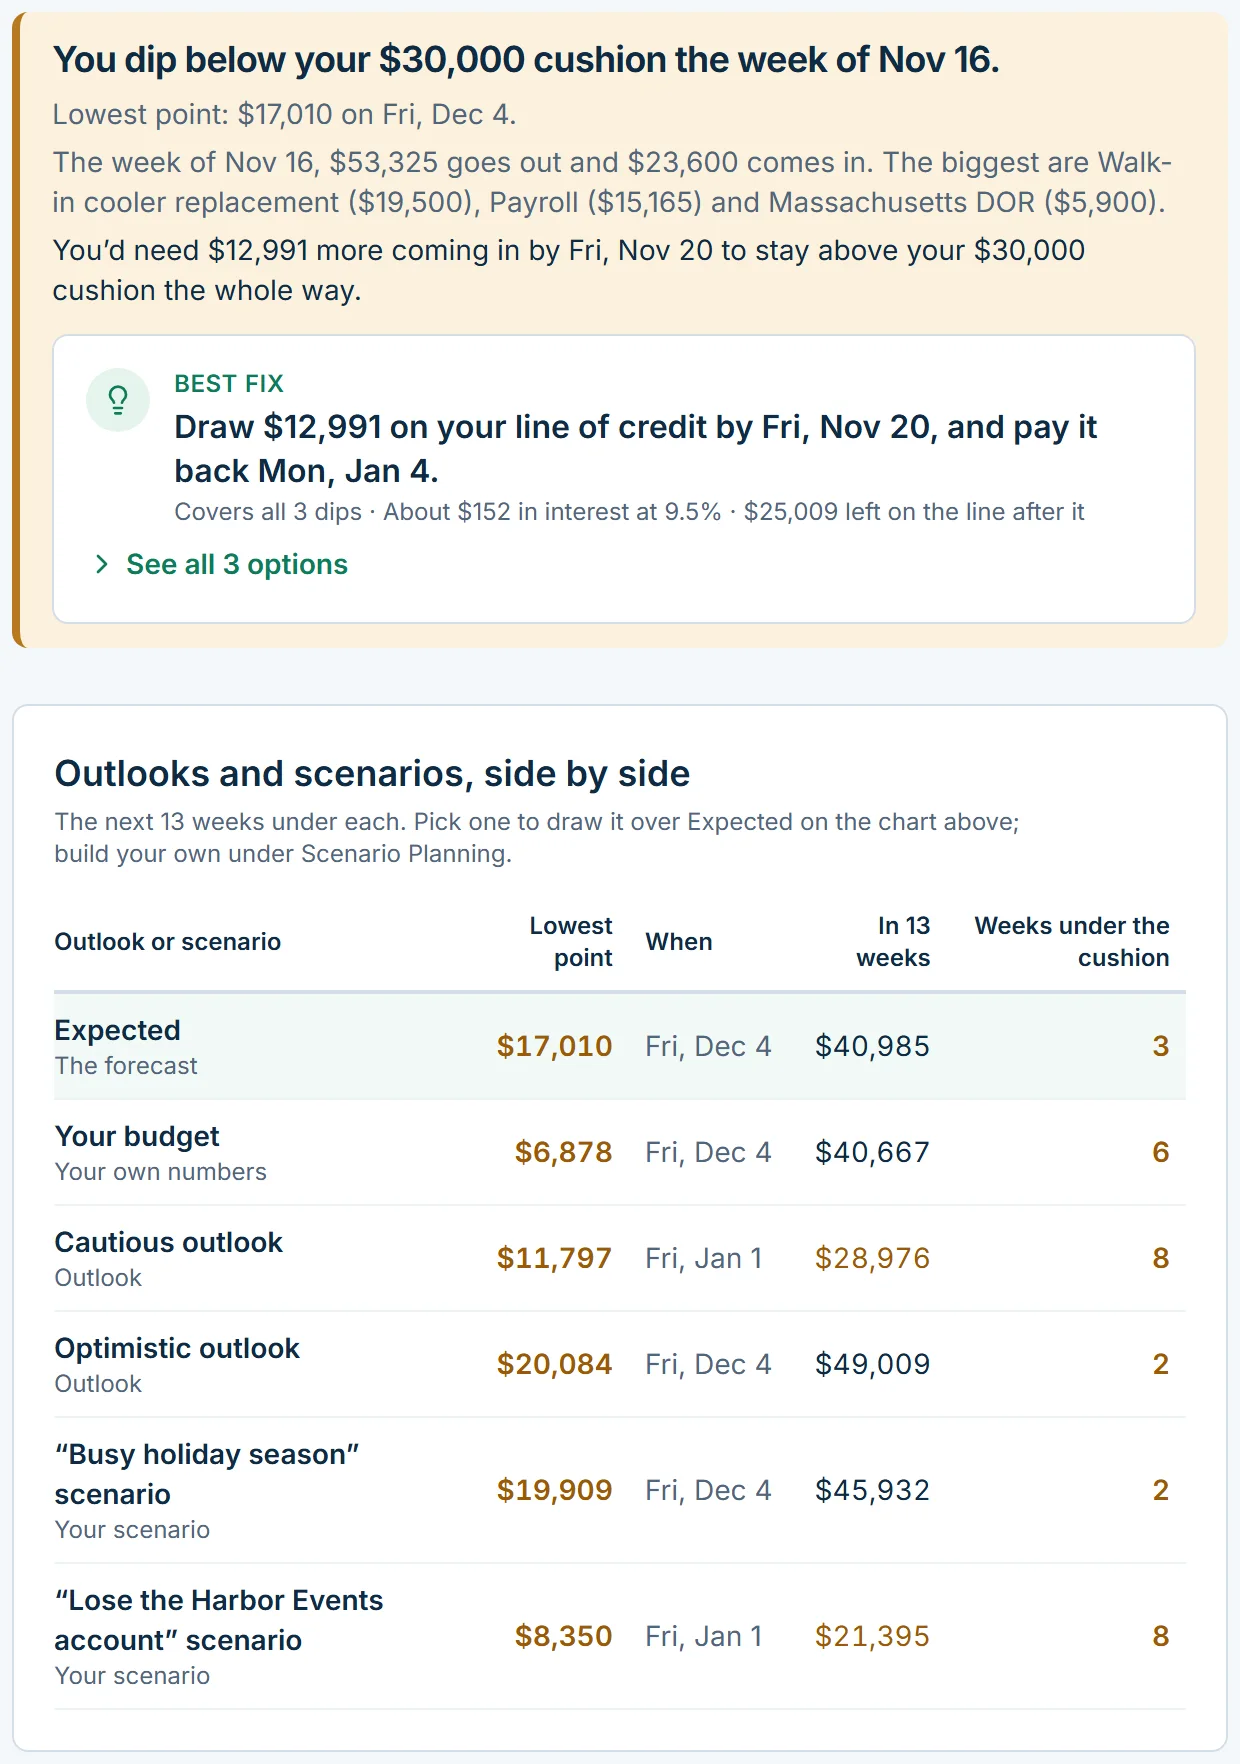
Know about a tight week while there’s still time to fix it
A shortfall you see six weeks out is a phone call to a customer or a bill moved by a few days. One you see on the day is a missed payroll. Flocuity is built to give you the six weeks.
- Set the balance you never want to go under
- See what your cushion is made of: tax set aside, a payroll reserve, and your own margin
- The verdict names the week, the cause and the shortfall
- The lowest point on each outlook: Cautious, Expected and Optimistic
- A Monday email with the week ahead, for every member who wants it
Taxes
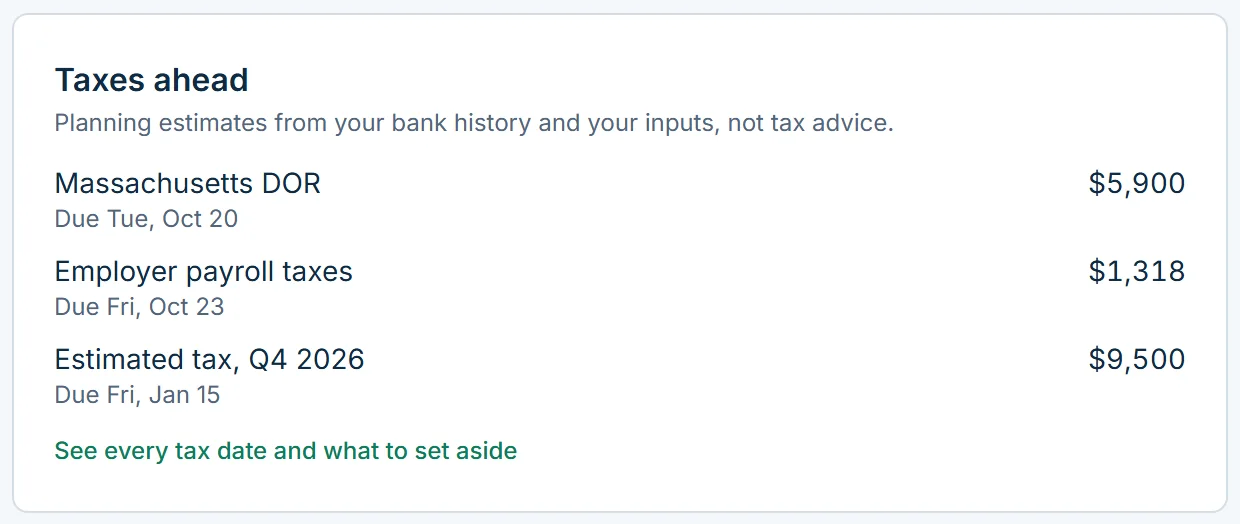
Quarterly payments that never sneak up on you
Flocuity reads your tax payments from your history, works out their rhythm, and puts the next ones in the forecast. It’s an estimate to plan with. Your tax return still comes from your accountant.
- Payroll, income, sales, property and entity taxes, each on its own schedule
- Estimated income tax from your profit so far this year, worked out from your bank history
- An amount to set aside, held back inside your cushion
- Due dates placed in the forecast ahead of time
- How much you can safely take out as owner pay this month, with your cushion and the next tax payment left alone
Debt & credit lines on Standard and Plus
Every loan, line and card, with its payments in the forecast
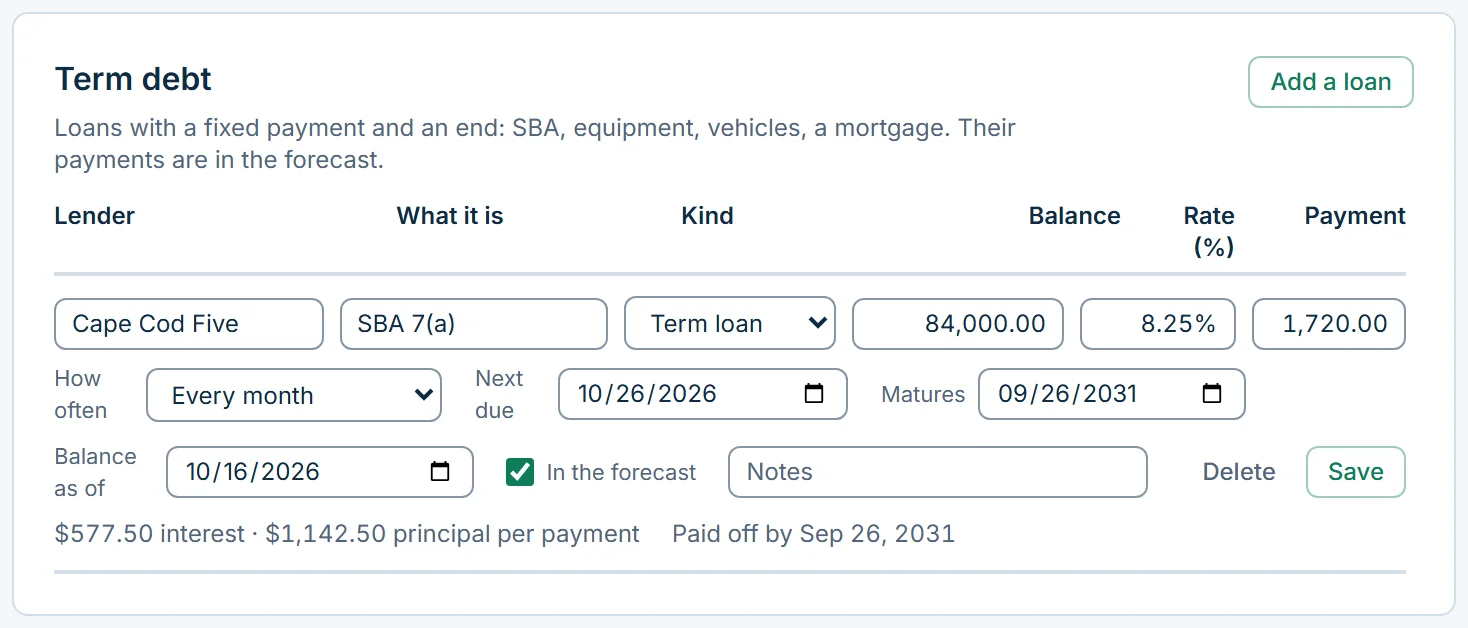
What you owe is part of where your cash is headed. Flocuity puts every payment on the day it leaves the bank, and the Lender Package reads the same schedule.
- Each loan, line of credit and card in one place, with its balance, rate and payment day
- Loan payments found in your bank history, offered for adding in one click
- Each loan payment split into interest and principal once you give it a rate, with the payoff date and a full amortization schedule; cards are counted on their payment day
- A warning when a balloon payment falls due within the next year, when a line or card is 80% drawn or more, and when a payment is too small to shrink the balance
Swipe the picture sideways for all of it.
Scenario Planning on Plus · reports on Standard and Plus
For the detail-minded
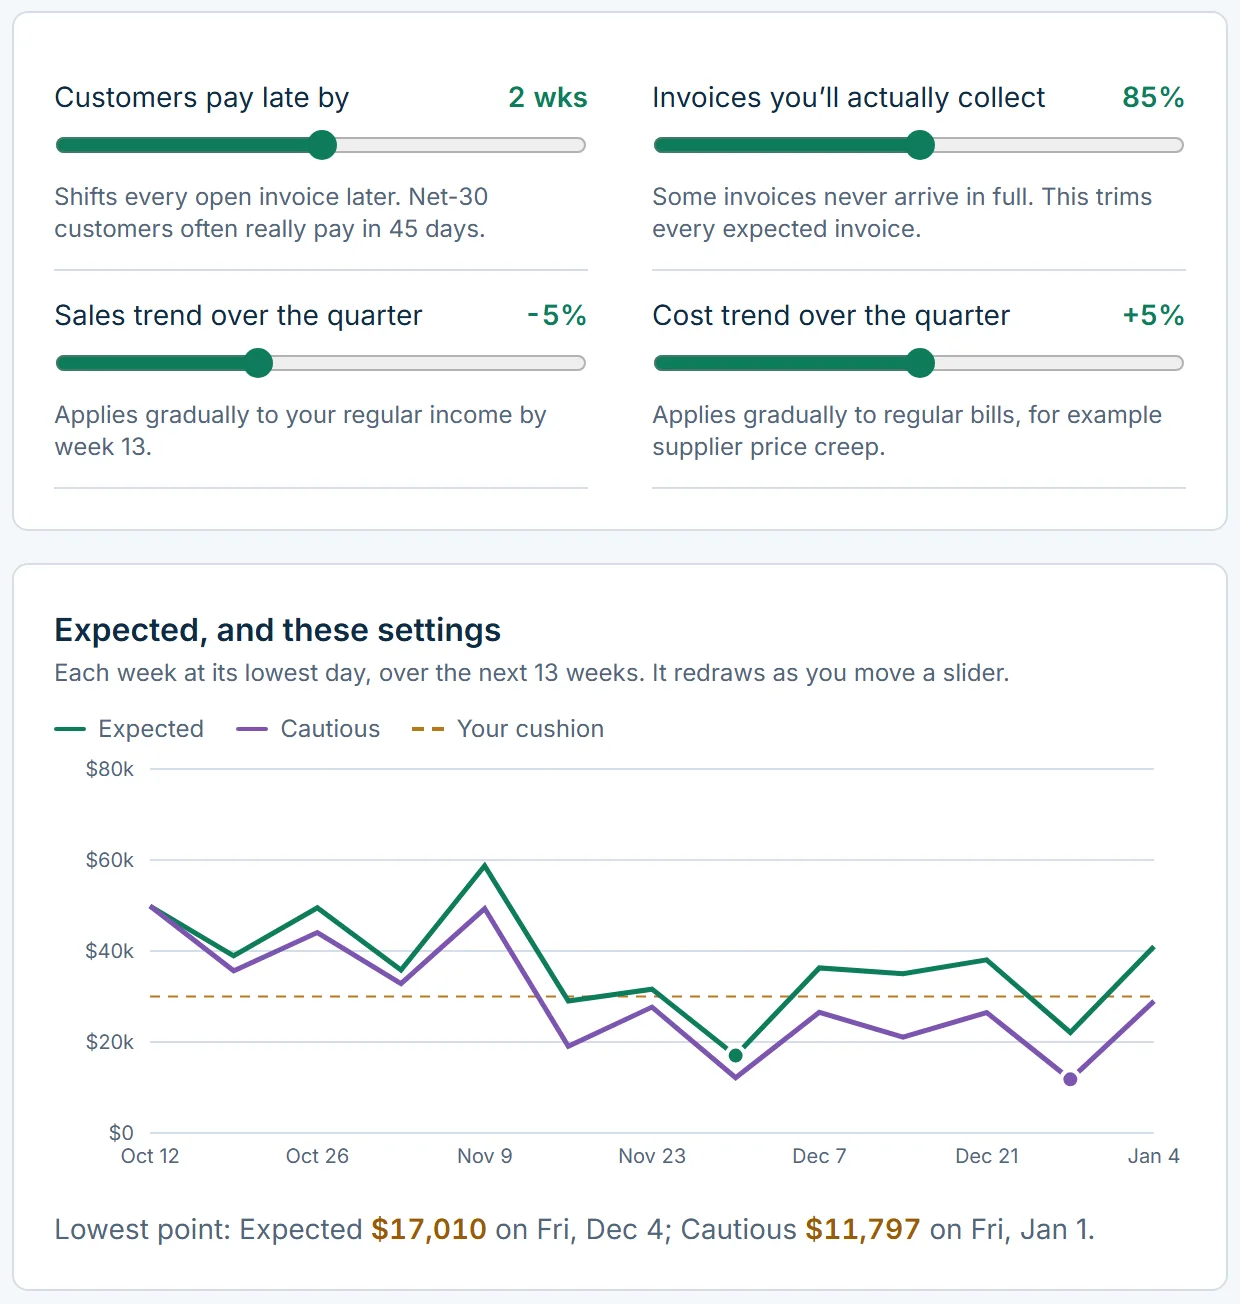
The Detailed view opens up everything behind the forecast. Change an assumption and see the effect at once.
- Growth, a slow or busy month, and one-off assumptions by category
- What-ifs you can save: slower collections, a lost customer, a new hire, a price rise
- Reports by category and period, forecast against actual
- Export to Excel
- An activity log of who changed what
The 13-week grid
The 13-week spreadsheet that fills itself in
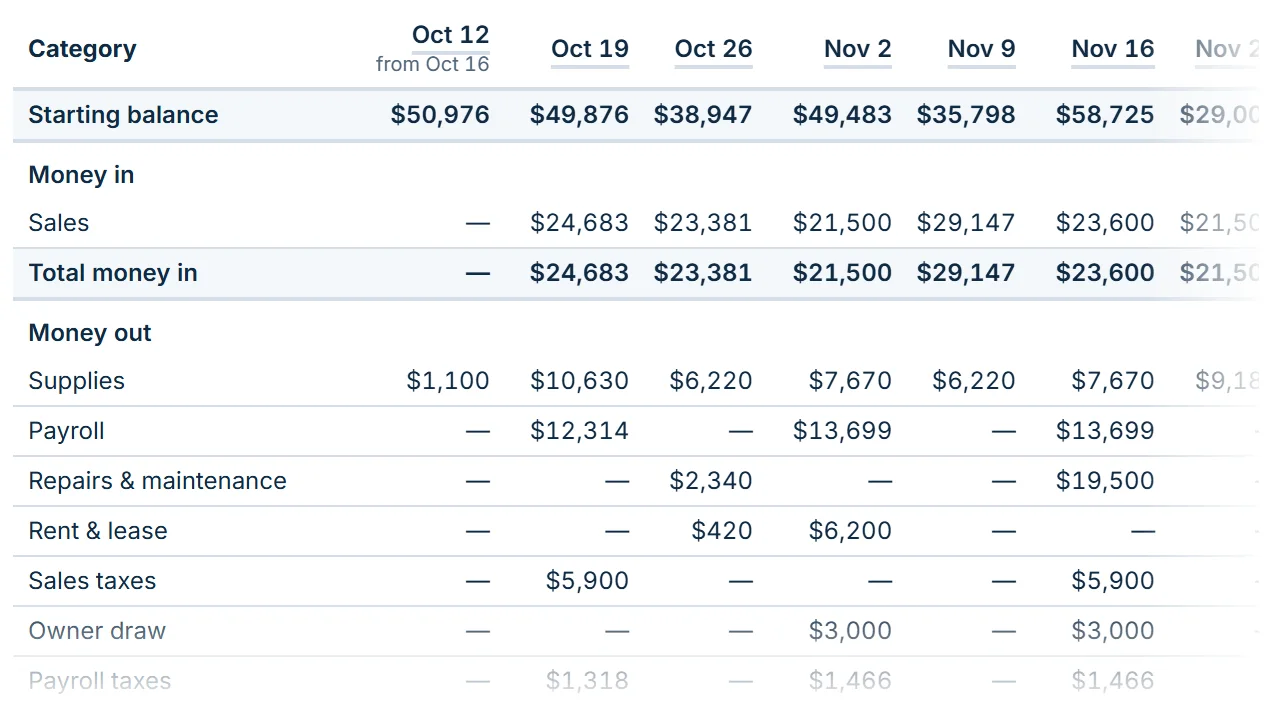
In the Detailed view, the forecast is the spreadsheet you’d build yourself, except it fills itself in from your bank and your books and rolls forward on its own.
- A column for every week, a row for every category, with the starting and ending balance
- Switch to a row for every customer and vendor
- Tap or click any week to see each payment in it, and where it came from
- Export to Excel for your own model or your accountant
Customer payment patterns on Plus
Net 30 rarely means 30
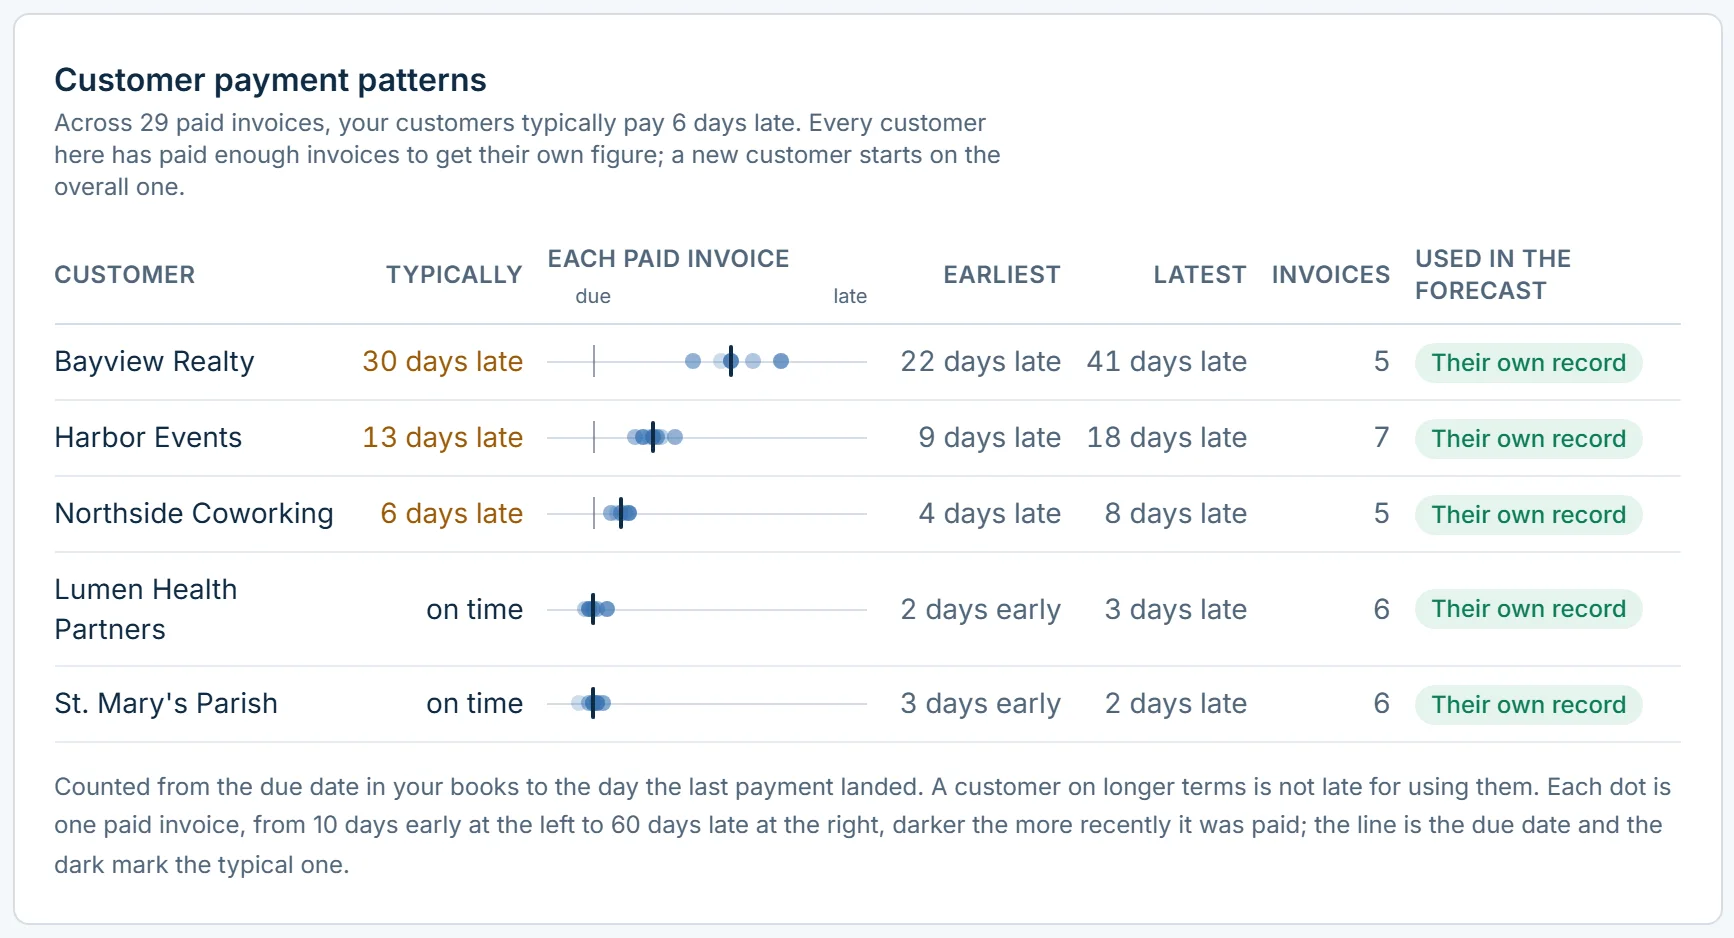
A forecast that assumes every customer pays on the due date is wrong about the customers who matter most. Flocuity learns how each one actually pays and plans for it.
- How many days early or late each customer really pays, from invoices already paid
- A customer gets their own figure once four of their invoices have been paid
- Their open invoices are dated by that habit, and never before the due date
- Who to chase first, and who is paying slower lately
- Needs QuickBooks Online or Xero, where the paid invoices come from
Swipe the picture sideways for all of it.
Customers on every plan · the Vendors tab on Standard and Plus
Who pays you, who you pay, and what’s changing
Customers and vendors are the people behind the lines. Flocuity keeps a page for each one and says when something about them changes.
- One line per customer, however your bank describes them, and a page for each with their invoices, payments and history
- A word when one customer is a large share of what comes in, or a regular payer is later than usual
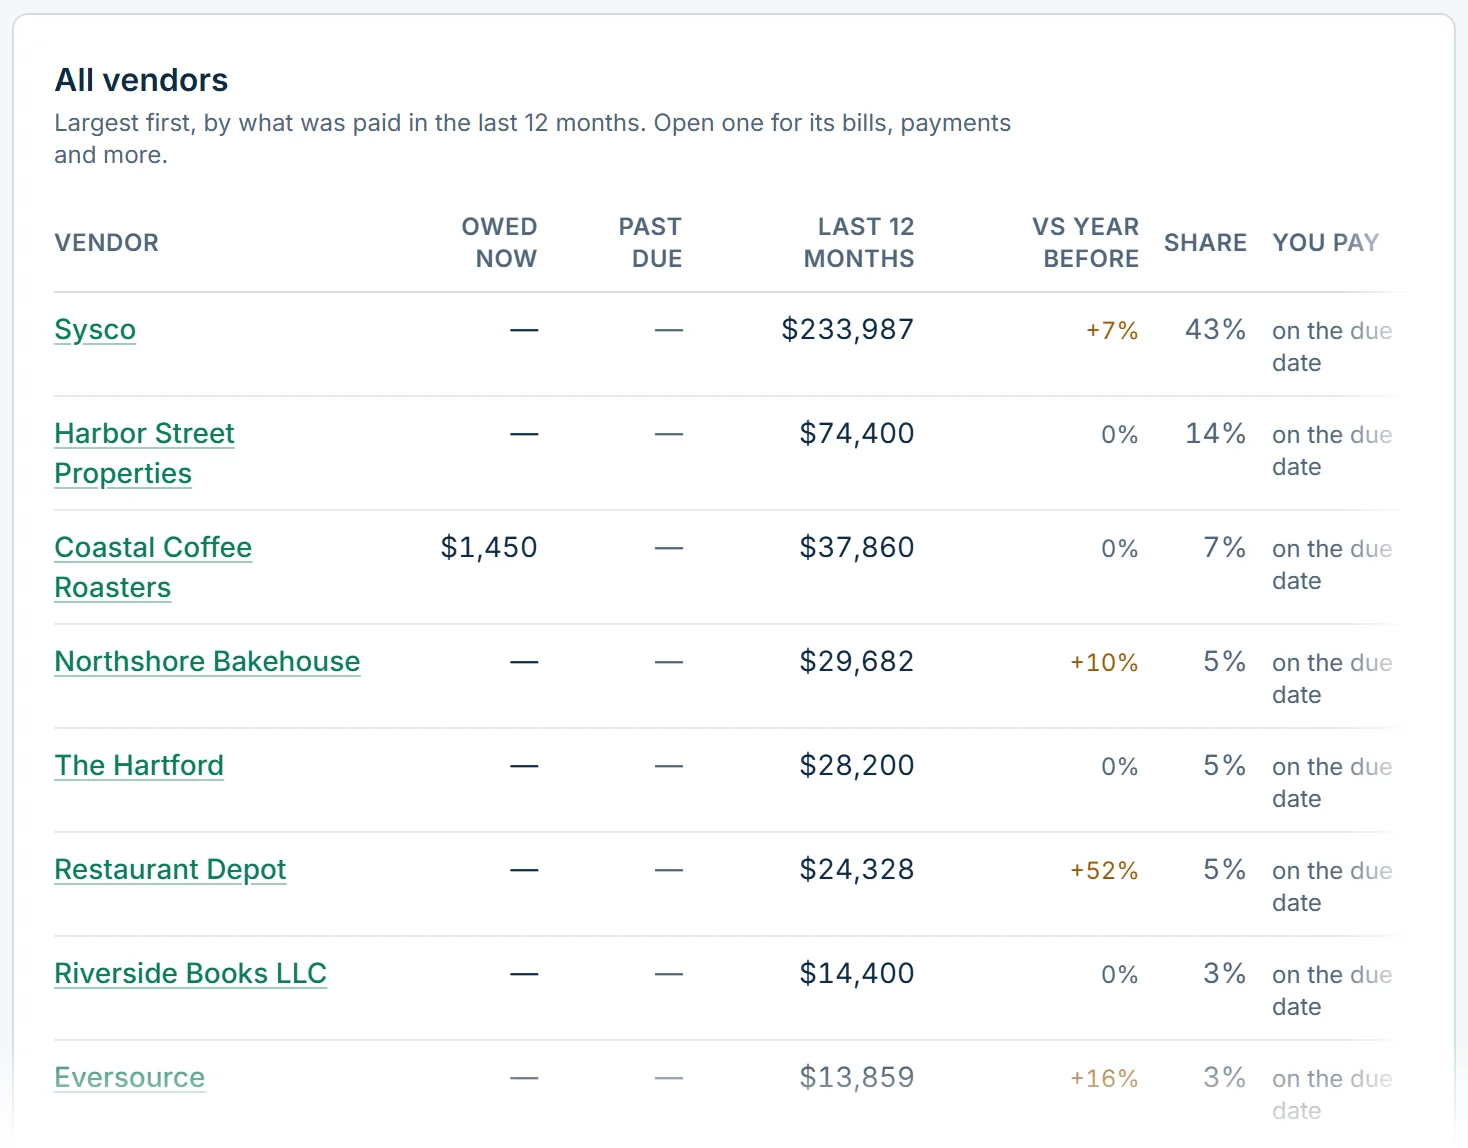
- Every vendor’s last 12 months beside the 12 before, so a cost that has crept up stands out
- Vendors paid $2,000 or more this year by check, ACH or wire, listed for a 1099 check
- Your payment terms per vendor: pay ten days after the due date, or early for a discount, and their bills are dated that way
- Checks on every plan: paid twice, far bigger than usual, a price that went up, a subscription you pay for twice
Swipe the picture sideways for all of it.
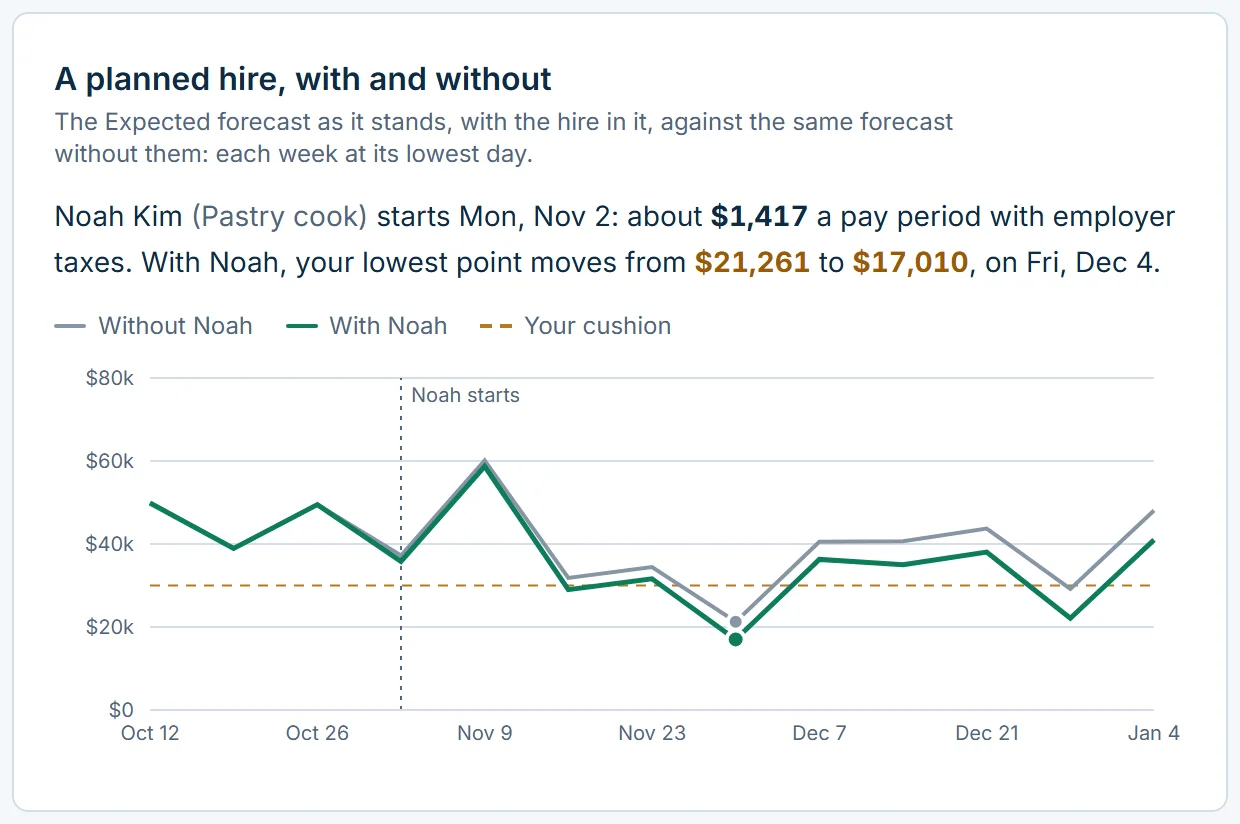
Staffing Model on Standard and Plus · planned hires and raises on Plus
Plan payroll person by person
The Staffing Model feeds straight into the forecast, so a new hire, a raise or a departure shows up in the weeks it actually hits your bank.
- Each person’s pay, schedule, start and end dates
- Employer payroll taxes calculated for you
- Planned hires and raises: see the effect on cash before you make the offer
- Pay details are private to the people you choose
- Import and update the team from a spreadsheet, or from Square with its timecards
Budget on Plus
What you meant to spend, against what you did
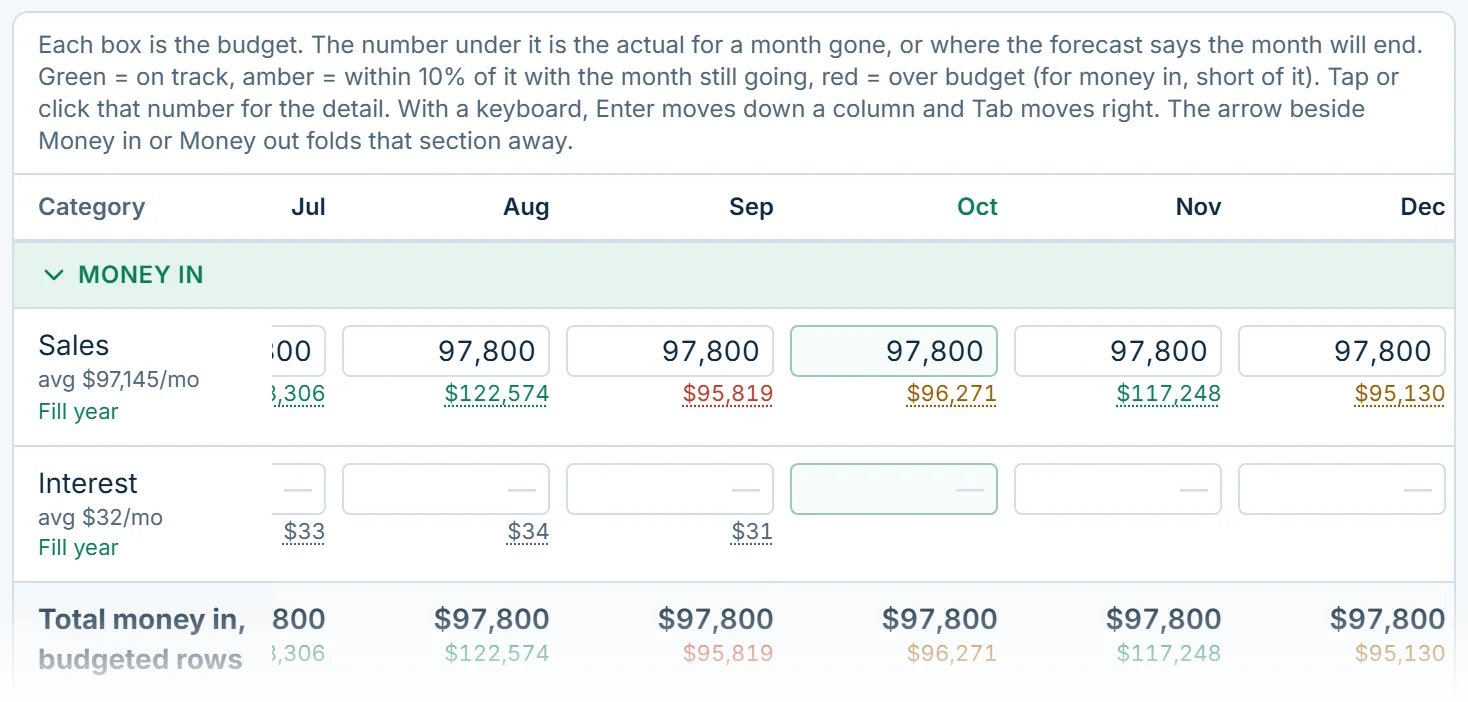
Set what each category should come to, and watch the year against it. The budget sits beside your forecast and never changes it.
- A figure per category per month, started from last year or from the forecast
- Budget, actual and forecast on one line, so a category going over shows early
- Export the whole year to Excel
Swipe the picture sideways for all of it.
Idle cash
See what your spare cash could be earning
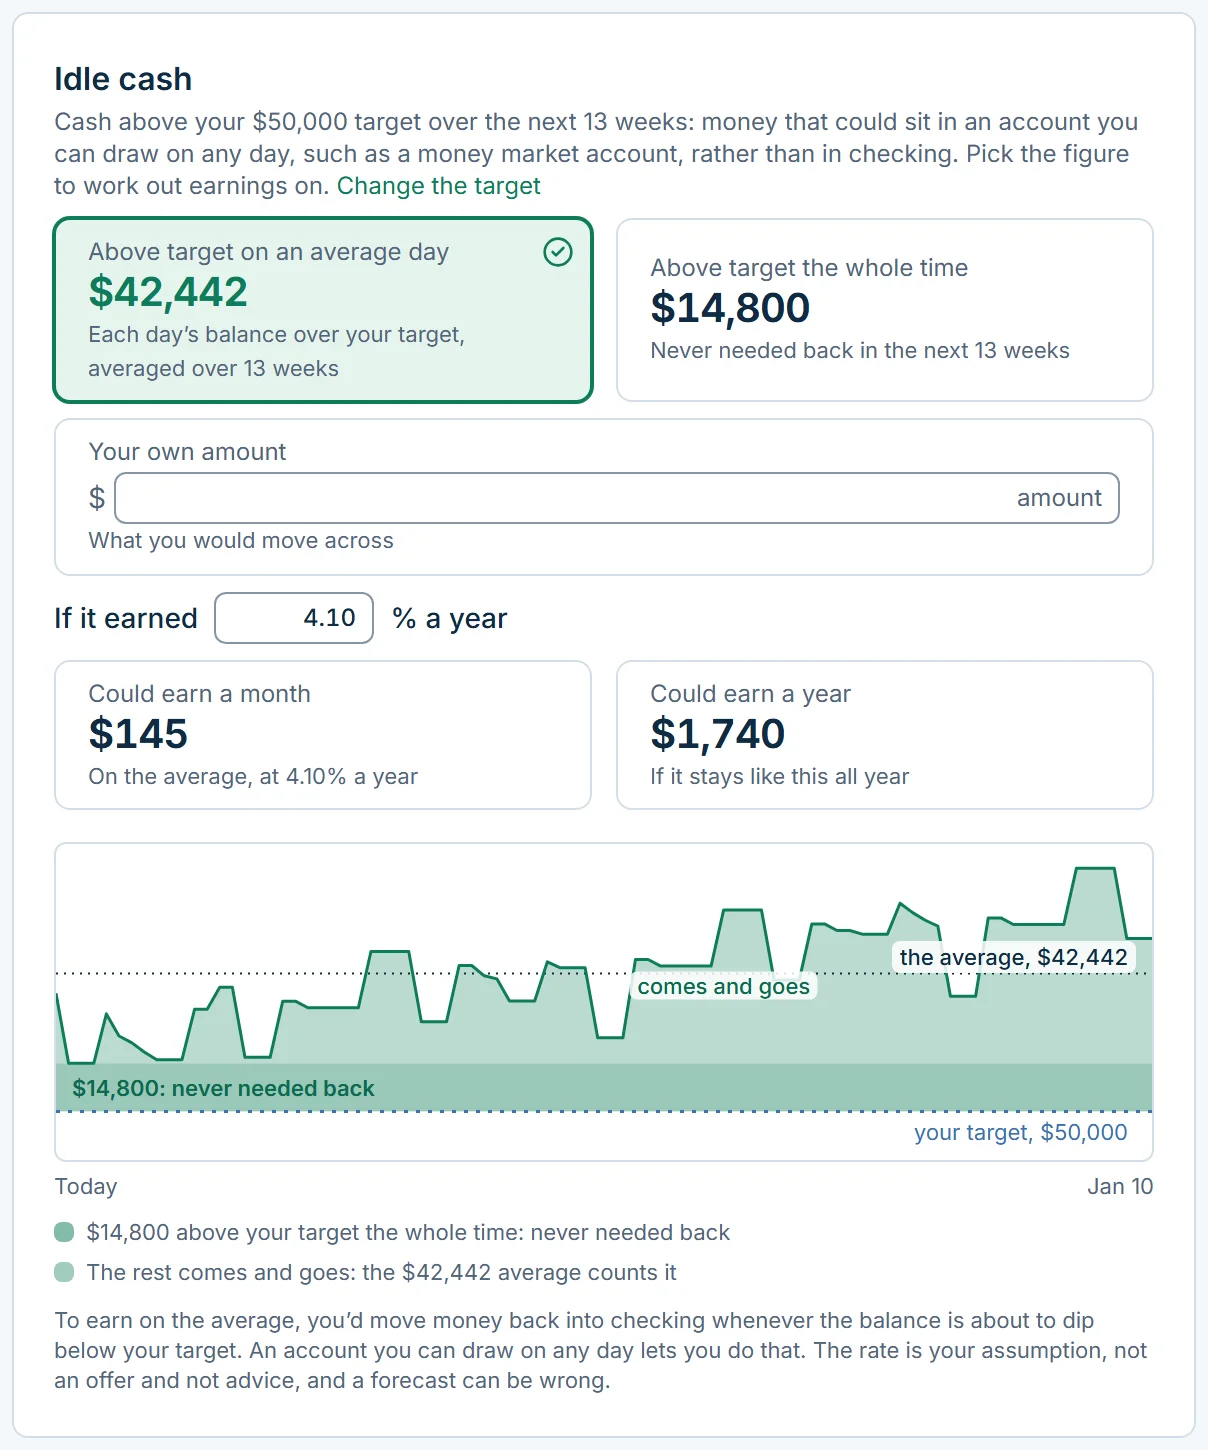
Many businesses leave tens of thousands in a checking account that pays nothing, because nobody is sure when it will be needed. The forecast answers that question.
- How much of the balance the forecast says you won’t need, and for how long
- What it would earn at a rate you type in
- Worked out at your own rate. We don’t recommend banks or accounts.
Lender Package on Plus
Ready when the bank asks
Every loan or credit line application asks for the same handful of schedules. Flocuity builds the cash ones from numbers you already keep, plus one page a spreadsheet can’t: where each figure came from and how current it is. Your statements and tax returns still come from your accountant.
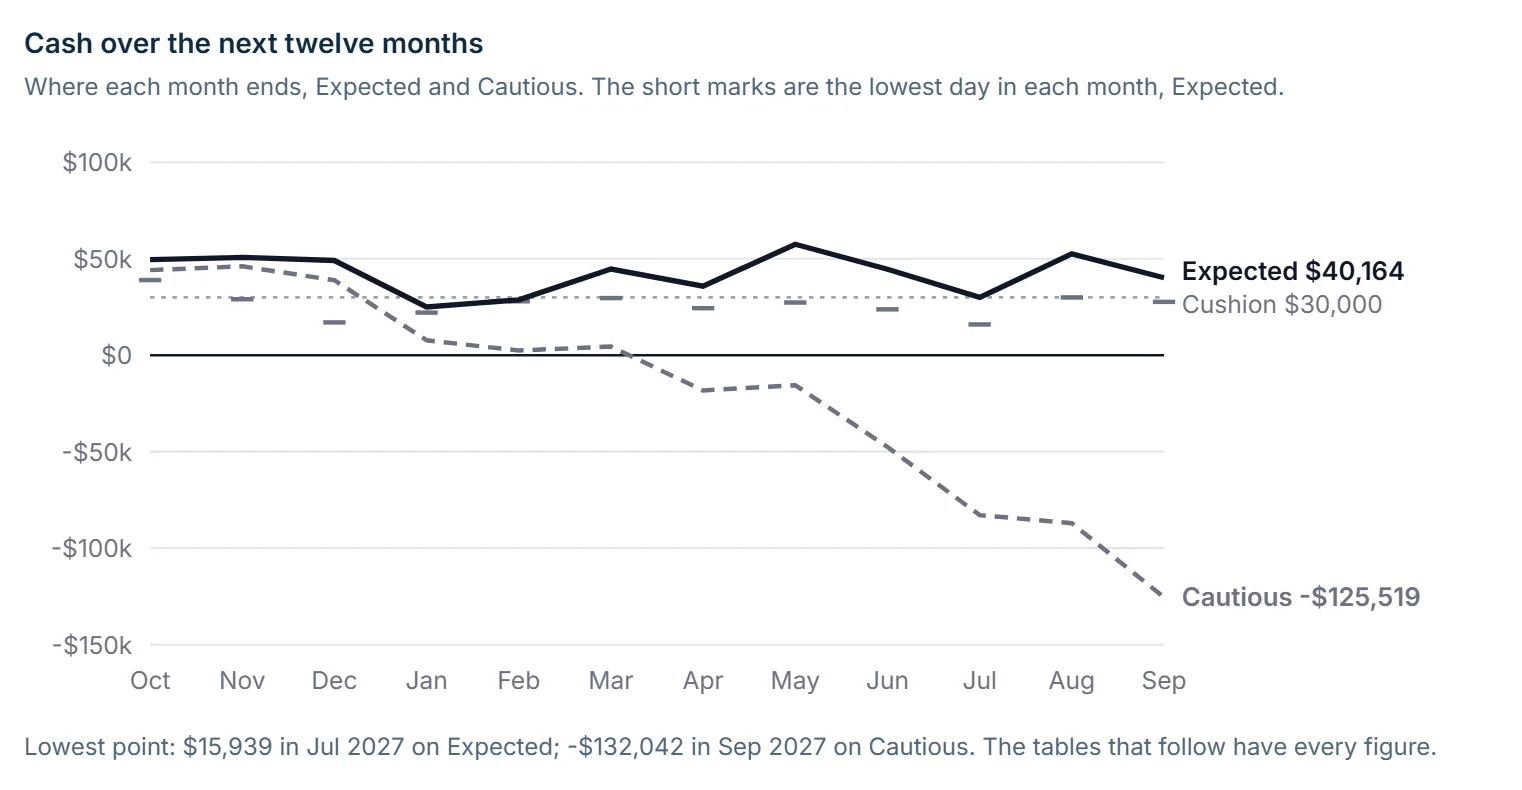
- A twelve-month projection, and the same twelve months in the Cautious outlook
- Your business debt schedule, with the columns a bank’s own form has
- Receivables and payables aging
- A page saying where every figure came from and when it was last updated
- Download as Excel, or print it
Swipe the picture sideways for all of it.
Getting your data in
About ten minutes to set up
A few short questions, one per screen, get everything the forecast needs, so we won’t come back asking for more. There’s more than one way to get your numbers in, and they aren’t equally good. Here they are, best first.
- Best
Connect your bank and QuickBooks Online or Xero
about 2 minutesYour bank gives today’s balance and every transaction as it lands. QuickBooks Online or Xero adds the categories you’ve already picked, and the invoices and bills that haven’t been paid yet.
- Good
Connect QuickBooks Online or Xero
about a minuteBalances, a categorized bank register and every open invoice and bill. It stays current on its own, but only as current as your books. A bank transaction nobody has reviewed in your books yet won’t show up.
- Good
Connect your bank
about a minuteYou sign in at your own bank and we get read-only access to balances and transactions. Up to two years of history is read at once, and new transactions arrive on their own, though your unpaid invoices and bills are not in a bank feed.
- Always available
Upload a bank export
CSV or Excel, from any bank, with nothing to connect. Flocuity figures out the columns and won’t count the same file twice. Your forecast is only as current as your last upload.
Add it by hand
A bill, an invoice or a one-time item, in seconds, right where the list is.
Sorted for you
Transactions are categorized automatically. Correct one, and Flocuity remembers it for that payee from then on. Payments it can’t place wait under To file, once per payee.
Which apps connect
- Connects directly
- Your bank, through Plaid, QuickBooks Online or Xero, Square and Stripe. All read-only.
- Payroll services: Gusto, ADP, Paychex and the rest
- Not connected. Payroll comes from your bank history, or person by person from the Staffing Model (Standard and Plus), which you can fill in from a spreadsheet all at once.
- PayPal, Shopify and Amazon
- Not connected. Their payouts land in your bank. Flocuity recognizes them as payouts and forecasts them from your recent pattern.
- QuickBooks Desktop and other accounting software
- No connection yet. Connect your bank, and add open invoices and bills yourself or from a spreadsheet. How that works
The pictures on this page are the app itself, with the made‑up numbers of a sample café. The idle cash picture is a second sample business: the café dips under its cushion, so little of its cash sits idle for long.
Try it with your own numbers
Answer a few questions, add your bank history, and see the next 13 weeks in about ten minutes. You don’t enter a card until you’ve seen your forecast.